Enhancing Observability: Distributed Tracing with OpenTelemetry

In modern distributed systems, understanding why a request is slow or where it fails can be challenging. This is especially true for authentication services like Nauthilus, which often interact with multiple backends like Redis, LDAP, or custom Lua scripts. To address this, Nauthilus provides built-in support for distributed tracing via OpenTelemetry (OTel).
With OpenTelemetry enabled, Nauthilus emits spans for every incoming request, allowing you to visualize the entire execution path—from the initial HTTP call to internal processing and backend interactions.
Why OpenTelemetry?
OpenTelemetry has become the industry standard for observability. By using it with Nauthilus, you gain:
- End-to-end Visibility: Track requests across service boundaries.
- Performance Bottleneck Identification: See exactly which part of the authentication flow takes the most time.
- Easier Debugging: Correlate logs with traces to understand the context of an error.
- Vendor Neutrality: Send your data to any OTel-compatible backend like Grafana Tempo, Jaeger, or Honeycomb.
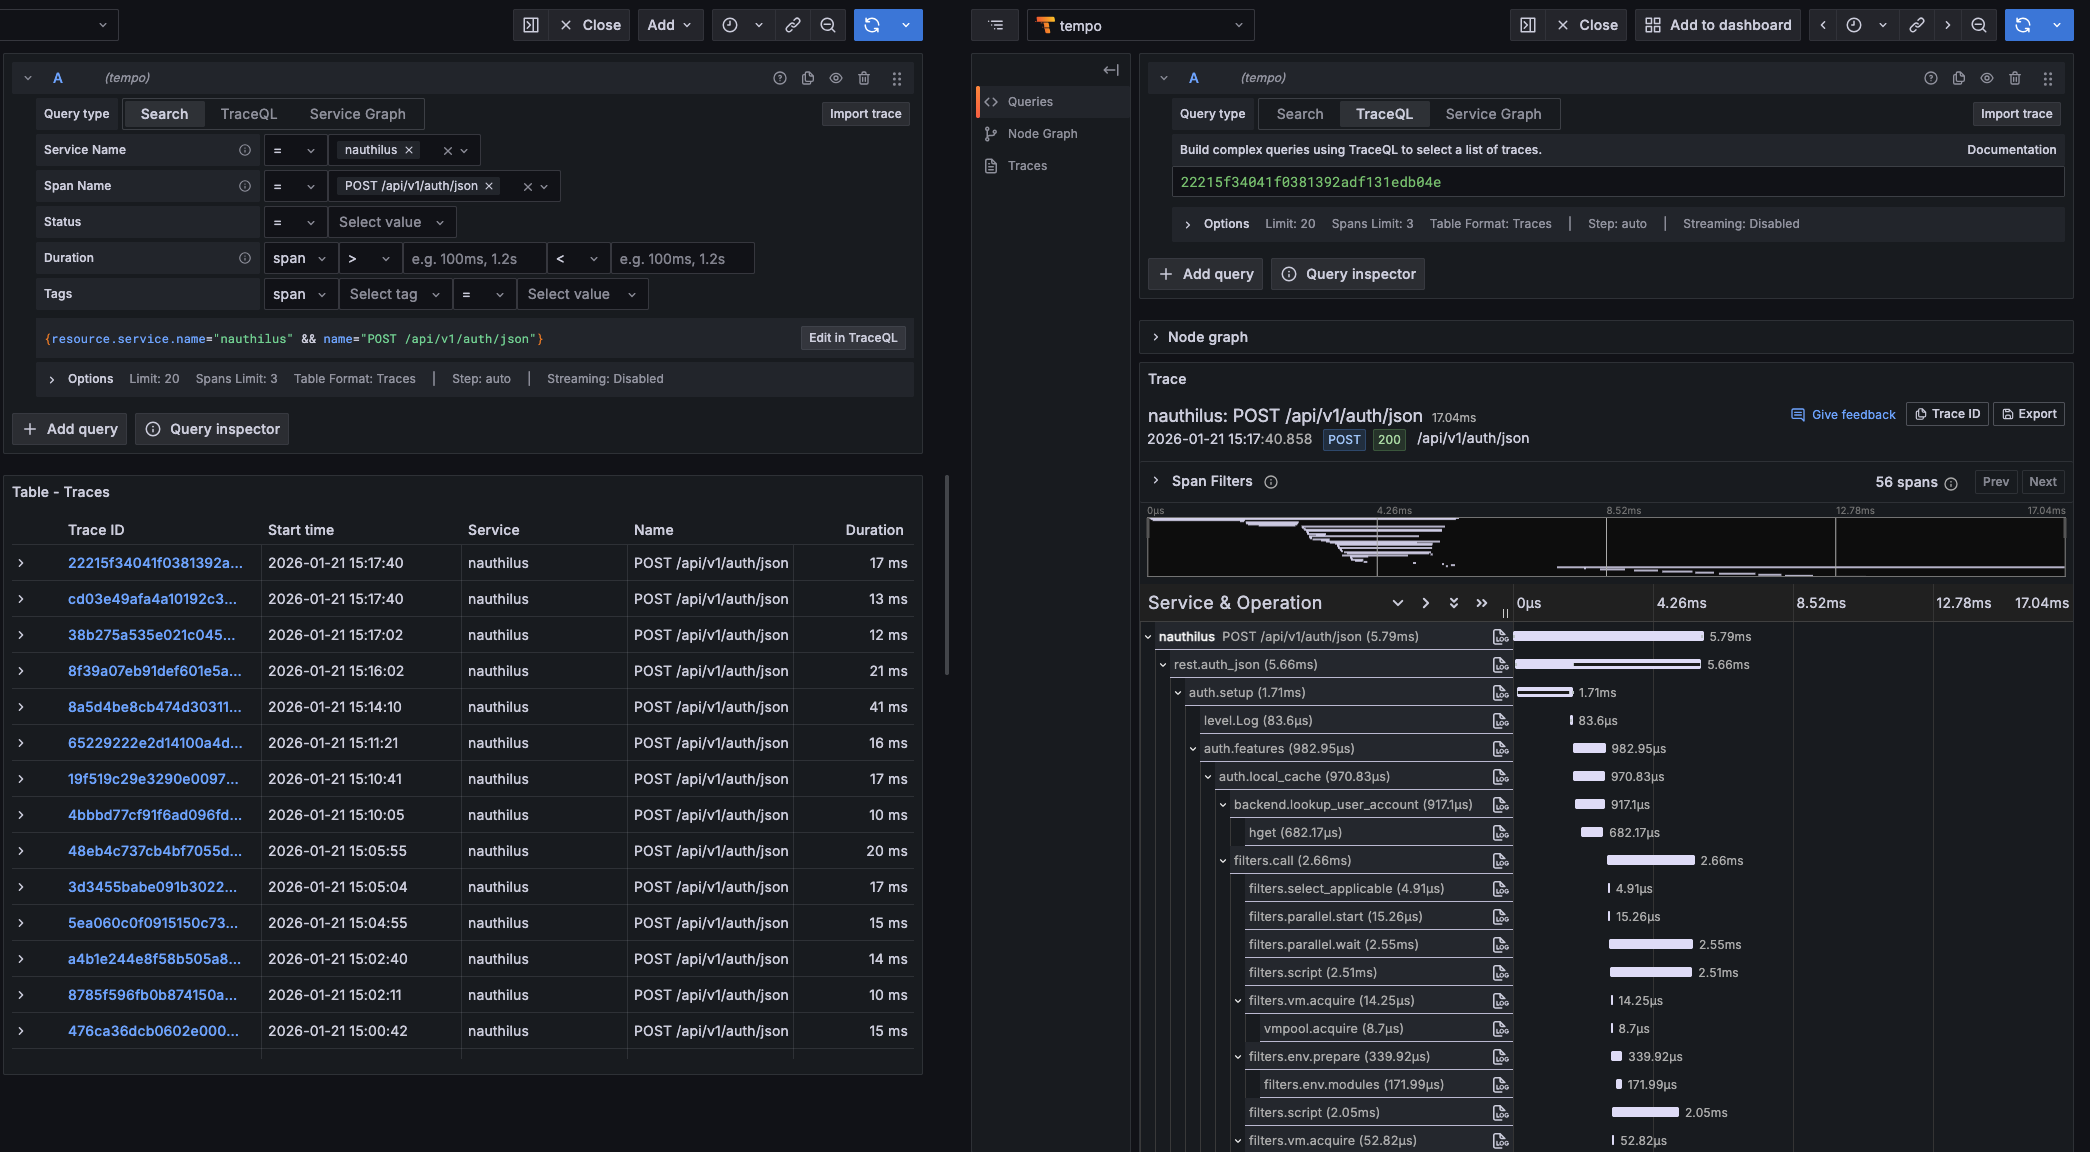
Here is an example of how a trace looks in Grafana Tempo, showing the detailed breakdown of a Nauthilus authentication request:
Getting Started
Enabling tracing in Nauthilus is straightforward. All configuration happens under the server.insights.tracing section in your YAML configuration.
Basic Configuration
To start sending traces to an OTLP/HTTP-compatible collector (like a local Tempo instance or an OTel Collector), use the following setup:
server:
  insights:
    tracing:
      enabled: true
      exporter: otlphttp
      endpoint: otel-collector.example.com:4318
      sampler_ratio: 0.1        # Sample 10% of requests
      service_name: nauthilus
Advanced Insights: Redis Instrumentation
If you use Redis for caching or as a backend, you can enable specialized instrumentation. This adds detailed events to your spans for every Redis command, helping you identify slow database queries.
server:
  insights:
    tracing:
      enable_redis: true
Custom Spans in Lua
Nauthilus takes observability a step further by exposing the OpenTelemetry API to your Lua scripts. This allows you to create custom spans for your business logic, such as external API calls or complex policy evaluations.
local otel = require("nauthilus_opentelemetry")

if otel.is_enabled() then
  local tr = otel.tracer("nauthilus/custom-policy")
  tr:with_span("evaluate.business_rules", function(span)
    span:set_attribute("user.group", "admin")
    -- Your logic here
  end)
end
Propagating Context
Nauthilus supports various propagation formats (W3C TraceContext, B3, Jaeger, etc.) to ensure that traces are correctly linked when Nauthilus is part of a larger service mesh or sits behind a load balancer like NGINX or Envoy.
server:
  insights:
    tracing:
      propagators: [tracecontext, baggage, b3]
Conclusion
Distributed tracing is no longer a luxury—it's a necessity for maintaining reliable services. By integrating OpenTelemetry directly into Nauthilus, we provide you with the tools to look "under the hood" and ensure your authentication layer is performing at its best.
Ready to dive deeper? Check out the full Tracing Guide and the Lua OpenTelemetry API documentation.